 By
By
Amazon Redshift 15 Minute Tutorial (and Schedule Reports into Slack Too!)
First, let's start with a new term to learn:
YACTYNTL: (Yet Another Cloud Thing You Need To Learn)

You may have heard of Amazon's data warehouse solution, Redshift - their latest and greatest magical thing in the cloud. If you're like me, you want to know more, but don't know where to start. The big cloud providers (AWS, Azure, and Google) are introducing these new whiz-bang technologies faster than we can absorb them. You get your arms around one, two more
In simple terms, AWS Redshift is a Data Warehouse. It's
Before we get ahead of ourselves, a small tutorial is a good place to start. Baby steps, friendly data, everyone's comfortable. Once you're settled in, you can point the vacuum at your own databases, and drink from the fire hose. We promise this tutorial will be as easy as our "how to send emails from sql server"
Why House Data in a Data Warehouse?
A Data Warehouse provides an organization with analytics, deep querying, and reports. They feature performance and scale not possible with "traditional" Relational SQL databases used in day to day operations.
Relational SQL Databases
A relational SQL database excels at storing and retrieving "real time" operational data. In technical terms, a good relational database provides ACID guarantees to data storage:
- A - Atomicity, which means "all or nothing". The classic example is a banking transaction. When transferring money between accounts, both accounts should update (or neither should).
- C - Consistency, which means "the database is always in good shape". Any operation has to leave the database in a stable state, without any half-baked writes.
- I - Isolation, which means "even if several things are happening at the same time, they all succeed". In other words, if there are many cooks in the kitchen, their dishes all turn out perfectly, as if cooked one at a time.
- D - Durability, which means "once something completes, it stays completed". The database writes updates to disk. Losing power doesn't matter. And so on.
While the above is critical to business software, it forces design decisions ill-suited for data analysis queries. These queries are expensive:
- They search across long time periods.
They group data according to deeply buried characteristics.- They join disparate data points to find correlations and trends.
Theoretically, relational databases can support queries like this, but they struggle with performance. This means slow
Data Warehouses
Data Warehouses began appearing in the 1980's (about the same time as mullets), as an attempt to solve the problems relational databases couldn't. In a nutshell, they addressed a few problems:
- Large organizations have a multitude of relational
databases, and need to run reports across them in a unified fashion. - Reporting can involve data across several tables, necessitating the use of (expensive) joins to unify the data.
- Expensive queries can kill operational databases.

A data warehouse solution solves these problems by:
- Merging the data from one or more relational databases
- Normalizing ("lumping") the data together in ways that support deep querying.
AWS Redshift
AWS Redshift builds upon the concept of data warehousing, supercharging it in a few ways:
Column-oriented storage
Let's say you have data that looks like this in a relational database:
ID NAME CREATED DESCRIPTION1 Harriet 1830/03/07 Town Gossip2 Charles 1832/10/12 Farming Stud3 Laura 1850/11/01 HalfpintMost relational databases are row-based, which means they store that data like this:1:Harriet,1830/03/07,TownGossip2:Charles,1832/10/12,FarmingStud3:Laura,1850/11/01,Halfpint
This is an efficient way to store data on
Harriet:1;Charles:2;Laura:3;

1830/03/07:1832/10/12:2;1850/11/01:3;

Town Gossip:1;Farming Stud:2;Halfpint:3;
In a nutshell, the *values become the keys*. This makes querying spookily fast.
Massive Parallelization
Querying column-oriented storage gets faster with the more processors you throw at it. With Redshift, data can live across many machines and storage. This means the processors don't "collide" when retrieving information from a single location. And it just so happens AWS has a decent number (astronomical, to be exact) of processors to throw at this problem. What this means for you:
- Cheap, Pay as you Go.
- Infinitely Scalable
- AWS takes care of all the bumps in the night.
Hard to argue against those benefits! Especially the bumps in the night. A person needs a good night's sleep, without worrying about money or hardware failures.
Let's Roll
While all the science behind Redshift is important, an example is worth a thousand techno-mumbo-jumbo paragraphs (was it Benjamin Franklin that said that?). Let's build one.

Data, Data, Who's Got the Data?
I wanted to use a decent sized (and relevant) dataset to walk through a Redshift example. It just so happens Stack Overflow recently released their 2018 Developer Survey! A data set about software development should pique the interest of any programmer. Feel the enticement as you read on!
The Data Vacuum
With our data source procured,
- Download from Stack Overflow, and upload into an AWS S3 bucket.
- Using SQL Workbench (more on that later), copy the data from the S3 bucket into Redshift. The copy consisted of two steps:
Define the table schema.
Stack Overflow provides a "schema" file, but Redshift requires a little more detail. After a little trial and error (I didn't know how big to make them), I settled on a varchar(1000) for each. I used a small bit of C# to parse the schema file and generate the SQL:
using (StreamReader sr =
new StreamReader(@"Downloads\developer_survey_2018\survey_results_schema.csv"))
{
StringBuilder sb = new StringBuilder("create table stack_overflow(");
bool haveOne = false;
while (!sr.EndOfStream)
{
var line = sr.ReadLine();
var column = line.Split(',')[0];
if (haveOne)
sb.Append(", ");
sb.Append(column + " varchar(1000)");
haveOne = true;
}
sb.Append(");");
Console.WriteLine(sb.ToString());
After executing the above, I had the following SQL:
```SQL
create table stack_overflow(Respondent varchar(1000), Hobby varchar(1000), OpenSource varchar(1000), Country varchar(1000), Student varchar(1000), Employment varchar(1000), FormalEducation varchar(1000), UndergradMajor varchar(1000), CompanySize varchar(1000), DevType varchar(1000), YearsCoding varchar(1000), YearsCodingProf varchar(1000), JobSatisfaction varchar(1000), CareerSatisfaction varchar(1000), HopeFiveYears varchar(1000), JobSearchStatus varchar(1000), LastNewJob varchar(1000), AssessJob1 varchar(1000), AssessJob2 varchar(1000), AssessJob3 varchar(1000), AssessJob4 varchar(1000), AssessJob5 varchar(1000), AssessJob6 varchar(1000), AssessJob7 varchar(1000), AssessJob8 varchar(1000), AssessJob9 varchar(1000), AssessJob10 varchar(1000), AssessBenefits1 varchar(1000), AssessBenefits2 varchar(1000), AssessBenefits3 varchar(1000), AssessBenefits4 varchar(1000), AssessBenefits5 varchar(1000), AssessBenefits6 varchar(1000), AssessBenefits7 varchar(1000), AssessBenefits8 varchar(1000), AssessBenefits9 varchar(1000), AssessBenefits10 varchar(1000), AssessBenefits11 varchar(1000), JobContactPriorities1 varchar(1000), JobContactPriorities2 varchar(1000), JobContactPriorities3 varchar(1000), JobContactPriorities4 varchar(1000), JobContactPriorities5 varchar(1000), JobEmailPriorities1 varchar(1000), JobEmailPriorities2 varchar(1000), JobEmailPriorities3 varchar(1000), JobEmailPriorities4 varchar(1000), JobEmailPriorities5 varchar(1000), JobEmailPriorities6 varchar(1000), JobEmailPriorities7 varchar(1000), UpdateCV varchar(1000), Currency varchar(1000), Salary varchar(1000), SalaryType varchar(1000), ConvertedSalary varchar(1000), CurrencySymbol varchar(1000), CommunicationTools varchar(1000), TimeFullyProductive varchar(1000), EducationTypes varchar(1000), SelfTaughtTypes varchar(1000), TimeAfterBootcamp varchar(1000), HackathonReasons varchar(1000), AgreeDisagree1 varchar(1000), AgreeDisagree2 varchar(1000), AgreeDisagree3 varchar(1000), LanguageWorkedWith varchar(1000), LanguageDesireNextYear varchar(1000), DatabaseWorkedWith varchar(1000), DatabaseDesireNextYear varchar(1000), PlatformWorkedWith varchar(1000), PlatformDesireNextYear varchar(1000), FrameworkWorkedWith varchar(1000), FrameworkDesireNextYear varchar(1000), IDE varchar(1000), OperatingSystem varchar(1000), NumberMonitors varchar(1000), Methodology varchar(1000), VersionControl varchar(1000), CheckInCode varchar(1000), AdBlocker varchar(1000), AdBlockerDisable varchar(1000), AdBlockerReasons varchar(1000), AdsAgreeDisagree1 varchar(1000), AdsAgreeDisagree2 varchar(1000), AdsAgreeDisagree3 varchar(1000), AdsActions varchar(1000), AdsPriorities1 varchar(1000), AdsPriorities2 varchar(1000), AdsPriorities3 varchar(1000), AdsPriorities4 varchar(1000), AdsPriorities5 varchar(1000), AdsPriorities6 varchar(1000), AdsPriorities7 varchar(1000), AIDangerous varchar(1000), AIInteresting varchar(1000), AIResponsible varchar(1000), AIFuture varchar(1000), EthicsChoice varchar(1000), EthicsReport varchar(1000), EthicsResponsible varchar(1000), EthicalImplications varchar(1000), StackOverflowRecommend varchar(1000), StackOverflowVisit varchar(1000), StackOverflowHasAccount varchar(1000), StackOverflowParticipate varchar(1000), StackOverflowJobs varchar(1000), StackOverflowDevStory varchar(1000), StackOverflowJobsRecommend varchar(1000), StackOverflowConsiderMember varchar(1000), HypotheticalTools1 varchar(1000), HypotheticalTools2 varchar(1000), HypotheticalTools3 varchar(1000), HypotheticalTools4 varchar(1000), HypotheticalTools5 varchar(1000), WakeTime varchar(1000), HoursComputer varchar(1000), HoursOutside varchar(1000), SkipMeals varchar(1000), ErgonomicDevices varchar(1000), Exercise varchar(1000), Gender varchar(1000), SexualOrientation varchar(1000), EducationParents varchar(1000), RaceEthnicity varchar(1000), Age varchar(1000), Dependents varchar(1000), MilitaryUS varchar(1000), SurveyTooLong varchar(1000), SurveyEasy varchar(1000))
```
Copy the data from S3 Bucket into AWS Redshift.
Just a little SQL required (substituting
copy stack_overflow

from 's3:///survey_results_public.csv'

iam_role ''

IGNOREHEADER as 1

FORMAT AS CSV
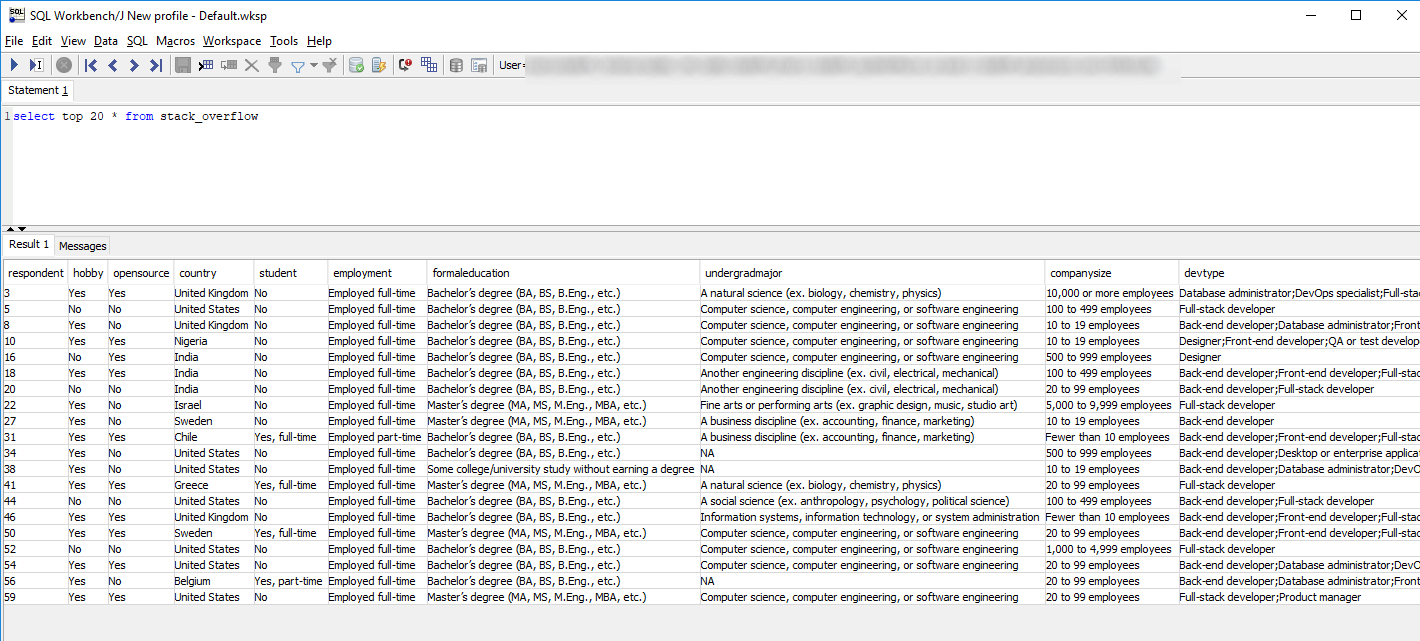
The Big Reveal
Once the above has completed, a quick query reveals the beautiful data!
select top 20 * from stack_overflow
Which SQL Clients to Use?
With your data in place, what's the best way to interact with it? I've tried a few ways:
- SQL Workbench - I typically use
Windows, and shy away from the "cross-platform"java-based tools. However, this one worked (and performed) perfectly. Setup your connection with JDBC (find it in AWS Console), and away you go. Sql Server Management Studio - I originally took this approach (being a Windows user and all). Itworks, but isn't ideal (you have to establish a "linked server" connection, and query from within an "EXEC" statement). Not the best approach unless you are dead-set on sticking with SSMS.Jetbrains DataGrip - If you don't mind springing for the license, JetBrains creates incredible developer tools. This one seems to do all the things. SQL Workbench met my needs, but if you want bells and whistles, I'd check this out.psql - yikes, a command line tool! Not for the faint of heart, but if it's your tool of choice, it will also connect to AWS Redshift.- Any ODBC/JDBC client - if you have an ODBC/JDBC client you already prefer, it should be able to connect to AWS Redshift without issue. Spin it up and give it a whirl!
SQLBot-ify
Now that we've got the data in place, let's plug things into SQLBot! SQLBot is a fantastic tool for publishing SQL reports to Slack. Doing so frees the data, making it accessible to non-techies. It also allows scheduling, which gives your team regular reports on data they care about.
Setup is easy, and only takes a few steps:
Establish Connection
Click "New Connection", and fill the form with your AWS Redshift goodness.
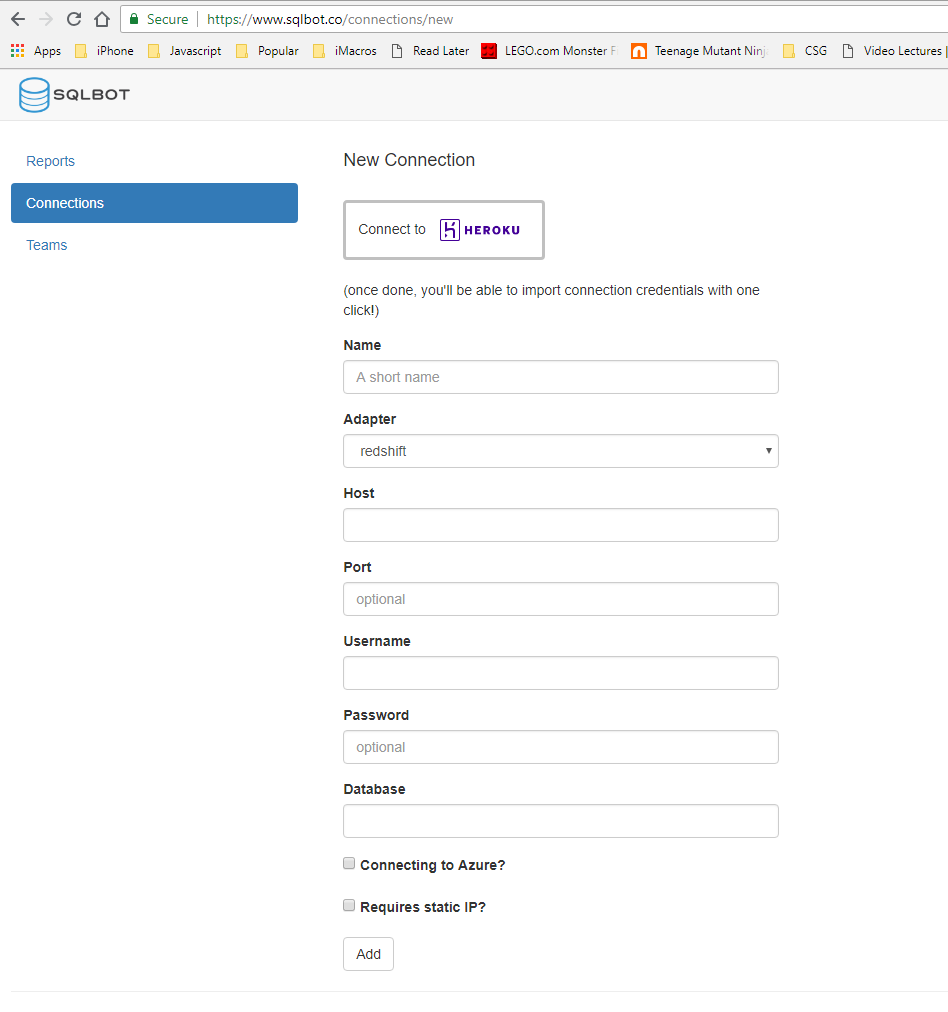
Some hints:
- The "Heroku" button is a handy bootstrap mechanism for importing connections, but you don't need it here. Just ignore for now.
- Select "Redshift" as your adapter.
- Host, Port, and Database can be found in your AWS console. "Database" was a little tricky for me - it's buried down in the "Cluster Database Properties" section
Create Report
Click "New Report", and select the connection you just created, and input some useful SQL. Here's a simple way to start:

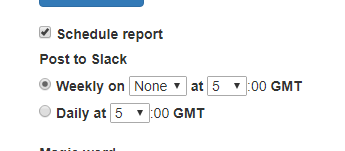
Daily Scheduled Report
Clicking the "Schedule Report" will dump these results daily:
And like magic, your results will say hello to you every day at that time in the Slack channel of your choice. It's smooth like butter. You can also get the results
/sqlbot {reportname}
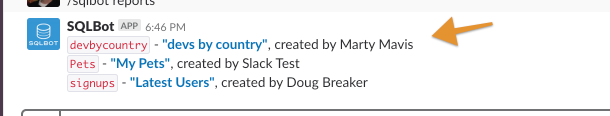
Let's see how this works:
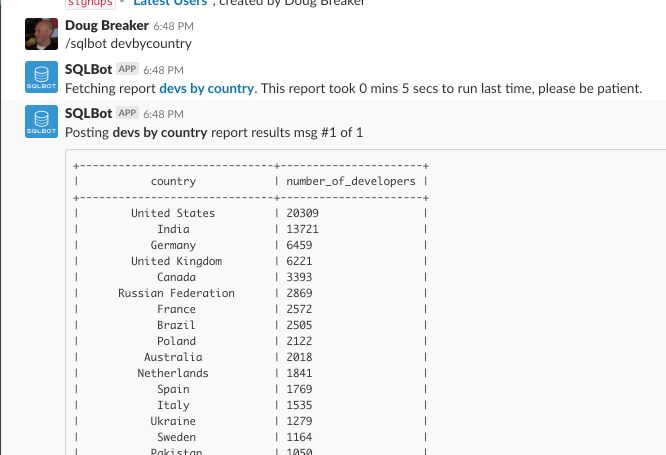
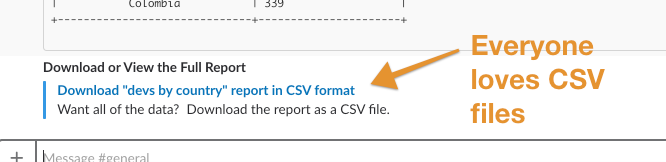
If you want to download the results into a CSV file, just click the friendly link and BOOM! the data rests at your fingertips.
Want to Learn More?
Now that you've seen a quick AWS Redshift tutorial in action, where to go to learn more? Here are some suggestions:
- AWS Documentation - this was all I needed to get up and running. Create a free account, follow their tutorial, and you'll be using Redshift.
- Find some large data to load. Stack Overflow's results are relevant and big, which I liked. Large datasets are where Redshift really flexes its muscles. There are tons of datasets out there (government, historical,
wikipedia , etc). Find one that interests you, and copy it to Redshift. - Extra Credit - my demo above only references the latest year of Stack Overflow results. A next step would be to load ALL the years, and map trends in data over time!
- Play with the data. The best way to learn SQL is to start simple, get familiar with the concepts, then dig deeper. For the heavier stuff, I'd again recommend AWS SQL Documentation. It runs the gamut from simple syntax to tutorials and best practices.
Happy Data Warehousing! If you need an ultra-simple way to run reports from Redshift data and publish the results into Slack, give SQLBot a try!